
Analytics
Six questions, answered from live data
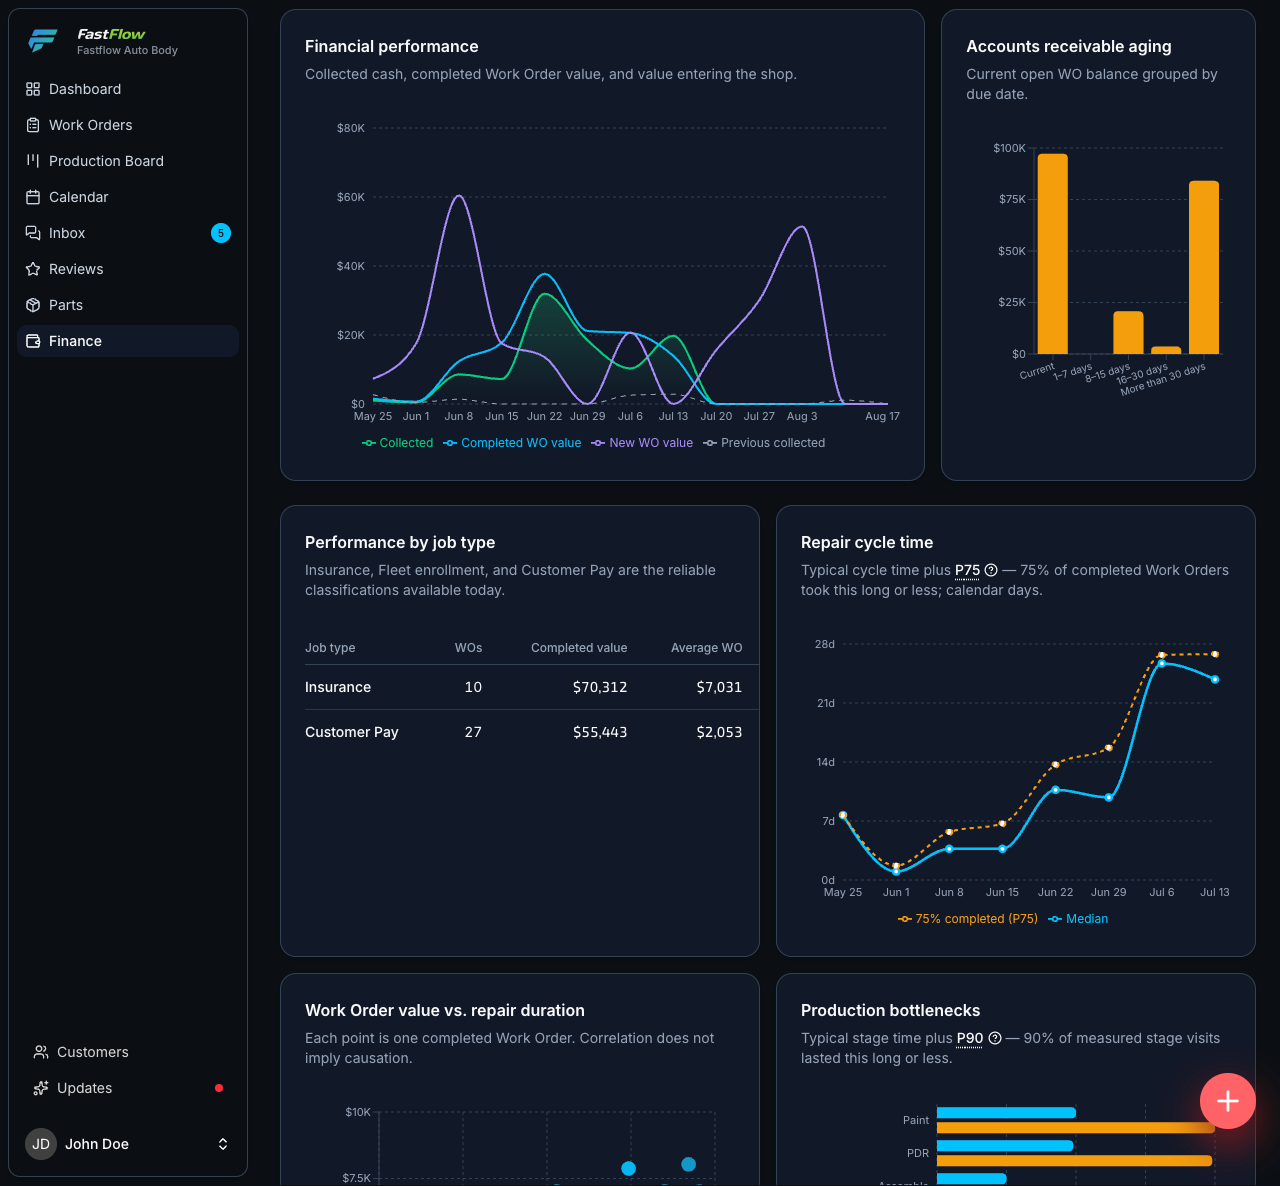
These numbers come from the same records the shop floor is working against — every figure computed on request from what is in the system right now. No nightly rollup to wait for, and no separate reporting database to fall out of sync with reality.
The questions that matter
Charts are not the point
A dashboard with twelve graphs on it has quietly moved the work of interpretation onto you. FastFlow starts from the questions instead — and every chart below exists because it answers one of them.
- 01 How long are vehicles actually staying?
-
Quote delivery dates you can actually hit, and find the jobs that are quietly holding a bay for two weeks.
Median days from start to delivery, plus P75 and P90 — because the average hides the handful of vehicles that ruined the month. Measured from real status events, never from when a record was last touched.
- 02 Where are repairs getting stuck?
-
Fix the one stage that is costing you days, instead of asking the whole shop to work faster.
Average, median and P90 duration for every repair stage, so which one is eating the week stops being a matter of opinion.
- 03 How much money is tied up in unfinished cars?
-
Know how much of your cash is sitting in the shop rather than in the bank, before you commit it elsewhere.
Work in progress value — everything currently in production or waiting for pickup, as one live number.
- 04 Which jobs are worth chasing?
-
See which work earns the most for every production day it consumes, so you can go after more of it.
Every completed job plotted by value against duration, plus value per production day compared across insurance, fleet and customer-pay work.
- 05 How much is outstanding, and how long until it lands?
-
Chase the money that is genuinely late, and plan around how long collection actually takes here.
Outstanding balance across five aging buckets, and the median time from finishing a job to actually being paid for it.
- 06 What should I do about it this week?
-
Start Monday with the two or three things that need a decision, not with a dashboard to interpret.
FastFlow surfaces what is worth acting on — a past-due balance, a stage running long — rather than leaving you to read charts and infer.
Three of them, drawn out
What these numbers look like when they are doing their job
Three questions are worth showing rather than describing. Everything else on this page is a figure, not a graph — because a chart that does not change a decision is decoration.
Question 01
Why an average cycle time is worth very little
Repair durations are not symmetrical. Most jobs cluster early, and a thin tail of vehicles sits for weeks — waiting on a part, a supplement, or nobody in particular. An average is pulled only slightly by that tail, which is exactly why it feels reassuring.
The P90 is where your loaners, your bays and your worst customer conversations live. FastFlow reports it next to the median so both are visible at once.
A right-skewed distribution of repair durations. The median sits early, P75 further right, and P90 out in the long tail, while a single average lands close to the median and misses the tail entirely.
- Median
- Half of jobs deliver by here
- P75
- Three in four by here
- P90
- The tail that ruins a month
An average cycle time lands somewhere near the median and says nothing about the right-hand side. The jobs on the right are the ones costing you a bay, a loaner and a customer’s patience.
Question 02
Slow is a symptom. A stage is a cause.
Knowing the shop is running long tells you to worry. Knowing that paint is holding vehicles longer than any other stage tells you where to put a second booth, an extra body, or a different scheduling rule.
Because stage durations come from real status transitions, the comparison holds up when somebody disputes it.
Horizontal bars for the repair stages Disassemble, PDR, Bodywork, Paint, Assemble and Detailing. The Paint bar is far longer than the others and is flagged as the stage holding vehicles longest.
- Disassemble
- PDR
- Bodywork
- Paint Longest stage
- Assemble
- Detailing
Total cycle time tells you the shop is slow. Duration by stage tells you where, which is the only version of the number you can act on this week.
Question 04
The most profitable job is not the biggest invoice
Shop capacity is measured in production days, not in dollars. A job that invoices well but occupies a bay for two weeks can be worth less to you than three quick ones — and no revenue report will ever say so.
Value against duration puts both on the same picture, and value per production day compares insurance, fleet and customer-pay work on the same basis.
A scatter of completed jobs. Job value runs up the vertical axis and production days run along the horizontal axis. Points in the upper left earn the most per day occupied; points in the lower right occupy the shop longest for the least return.
Two jobs can invoice the same and cost you very different amounts of shop. The one that took four days paid for the bay; the one that took eleven paid for a third of it.
Questions three and five do not need a chart. Work in progress is one number. Outstanding balance is a list you work through, broken into five aging buckets and reconciled against the ledger — which is why it lives on the finance side.
See receivables and aging in FinanceHow the numbers are made
A metric you cannot trust is worse than no metric
Two decisions are worth knowing about before you rely on these figures. Both cost us a better-looking dashboard.
Cycle time needs real events
A job only counts toward cycle time if it has genuine start and completion events. FastFlow will not substitute a record’s last-modified date to fill the gap — a smaller honest sample beats a complete misleading one.
Collected cash, not invoiced revenue
Because there is no single reliable invoice date across every kind of job, FastFlow reports money actually collected rather than a revenue figure that would quietly mean different things for different jobs.
Every figure FastFlow reports
What is measured, how it is measured, and where FastFlow deliberately declines to produce a number at all.
-
Cycle time, with percentiles
See how long vehicles really stay, not how long you hope they stay. Average and median days from start to delivery, plus P75 and P90 — because the average hides the jobs that hurt. Measured from real status events, never from a record’s last-modified date.
-
Stage bottlenecks
Find the stage that is costing you days before it costs you the account. Average, median and P90 duration for every repair stage, so which one is eating the week stops being a matter of opinion.
-
Work in progress value
Know how much cash is tied up in vehicles you have not delivered yet — everything in production or waiting for pickup, as one number.
-
Collected revenue and outstanding balance
Cash actually collected, cash still owed, and the median time from finishing a job to being paid for it — the gap that decides whether a busy month is also a solvent one.
FastFlow reports collected cash rather than invoiced revenue, because there is no single reliable invoice date across every job.
-
Revenue tiers
Collected, confirmed receivable and pending approval kept separate — so no month looks good on the strength of estimates nobody has approved.
-
Value against duration
See which jobs earn the most for every production day they consume. Every completed job is plotted by value against duration, so the work worth chasing separates from the work that only looks profitable.
-
Performance by job type
With limitsCompare insurance, fleet and customer-pay work on value, duration and value per production day — the numbers behind deciding which accounts to take more of.
Three job types: insurance, fleet and customer pay.
-
Automatic insights
FastFlow surfaces the two or three things worth acting on this week — a past-due balance, a stage running long — instead of leaving you to read charts and infer.
-
Live figures
Every number is computed on request from current data. There is no nightly rollup to wait for and no reporting database to fall out of sync.
Ask it your own question
Tell us the number you cannot get out of your current setup. In 30 minutes, screen shared, we will show you whether FastFlow answers it — or say plainly that it does not.